
MIT Overseer Observer Mod
We’ve been experimenting with the StarCraft 2 Galaxy Editor at the MIT Game Lab over the summer and we’d like to share our current prototype casting tool. The MIT Overseer project aims to provide casters with real-time graphics to help them tell the story of a game while it is in progress. We are trying out several different ways of displaying what happened in the past of a single game and anticipating what might happen in the near future.
Our project isn’t meant to compete with excellent observer mods like GameHeart. Currently, it is a tech demo so that we can start getting community feedback. We’re trying to identify what subset of hacked-together features are worth keeping and refining. Once we hear back from StarCraft viewers, casters, and players, we’ll focus on simplifying and streamlining our implementation, integrating it with other popular casting tools if given the opportunity.
Any feedback would be much appreciated, particularly if you’re involved in StarCraft 2 casting or an active spectator. And if you cast a game on “MIT Akilon Wastes”, please post your links to your videos. Thanks!
Stories and casting
We’re focusing on the stories that arise and revolve around competitive play, not the cutscenes or lore of StarCraft 2.
Stories can help spectators understand competitive games. Analytical casters often need to relate the history of a game to explain how it ended up in a later state, revealing the long-term consequences of early decisions. First-time viewers, lacking technical knowledge, can still engage with the storylines of players: their tournament results, their rise through the brackets, and the ups and downs of a series. Casters use stories to add emotional weight behind every event in a game of StarCraft, which is already rife with dramatic irony and suspense.
To tell a good story, casters need to describe a series of events to give spectators sense of where situations came from and where they are going. The SC2 community now has many good options for depicting the current state of an ongoing game, including the different solutions presented by GameHeart, ESL, Karwas, and Blizzard. However, up-to-date historical statistics are only presented in coarse cumulative numbers (e.g. Workers Killed). Casters often struggle with mental math when discussing them in a live situation. Alternatively, analysis tools such as Sc2gears and GGTracker can present the timeline of a game in very fine detail, but they currently only analyze games that have already concluded.
Top row: Comparing players
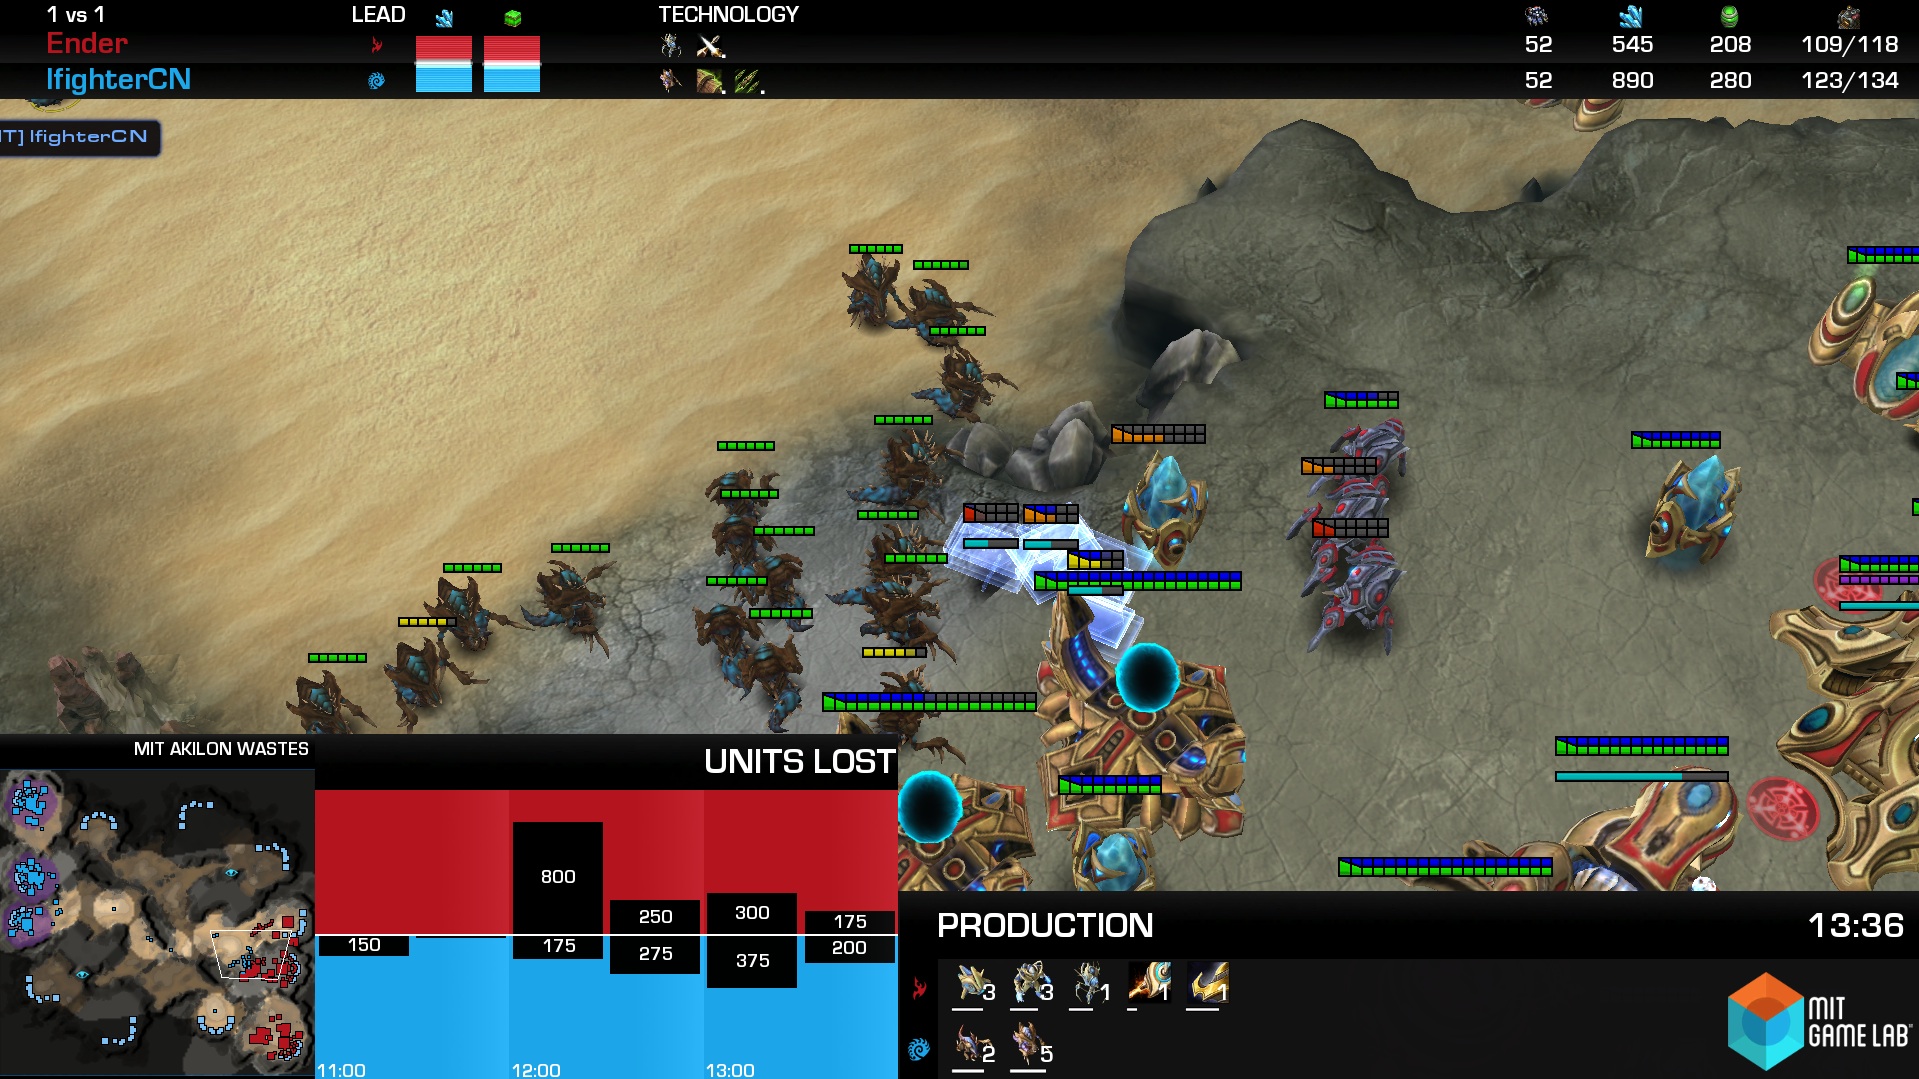
The top of the screen is often more visible in a Barcraft setting; the bottom is often obscured by the heads of other spectators in a sports bar. We have designed the top row of MIT Overseer to emphasize who is ahead and who is behind, while the bottom row has more information for home and VOD viewers who may wish to study a strategy for their own play.
Match score and player names (Number keys with Control and/or Shift)
 In the first few seconds of opening up a live broadcast or a VOD recording, spectators need to quickly grasp who is playing and where they are in the tournament. Existing observer interfaces already display match scores and player names to help viewers understand the context of the game they are watching, as well as contextual tournament information (e.g. “Winners Bracket”). We add the match scores to compute which game viewers are watching in a series and made the number large enough to be legible even in video thumbnails.
Resource Lead
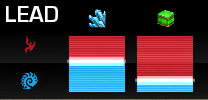 Adjacent to the player names is the Lead Graph, which shows which player is currently ahead in terms of mineral and gas efficiency. A quick glance shows who is leading the current game based on the difference between their resource spending and loss.
This was a deliberate attempt to address the frequent caster exclamation, “BUT AT WHAT COST?” We feel this metric reveals a player’s advantage more accurately than supply counts, and we expand on this concept with the Advantage graphs (see below).
Technology
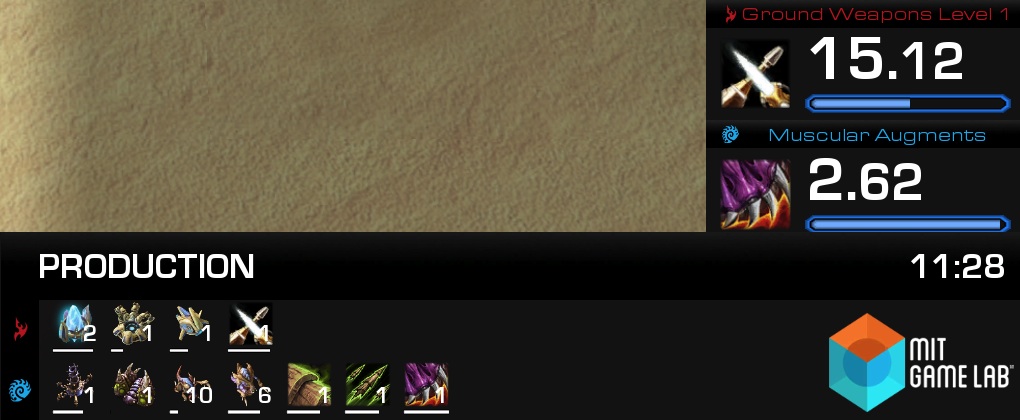
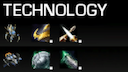 In addition to displaying army-wide armor and weapon upgrades, a visual format borrowed from GameHeart, we’ve added an icon that shows the newest type of unit built by each player. This provides a snapshot of each player’s technology level and can foreshadow when the game is about to enter a new phase. For instance, the moment when Jaedong performs his muta switch, the mutalisk icon will appear as soon as he queues them up, and casters can point to the change in the icon while building up excitement for the inevitable rain of death.
Since the Technology icons line up with each player’s match score, name, lead, and economy data, the unit icon serves a secondary purpose of assisting viewers who may be unfamiliar with the three race icons of StarCraft 2. In asymmetrical matchups (i.e. TvZ, PvZ, PvT), spectators can visually match the units on the field with the appropriate icon in the Technology column, and then extrapolate that association between players and units across the entire top row.
Economy
Experienced viewers will find mineral/gas/supply counts in their standard screen locations, organized to take a little less horizontal space. This allows us to add a worker count, which new viewers may find easier to understand as a metric of economic advantage over numerical income. Admittedly, the impact of MULEs on a player’s economy is not apparent and we are considering how we can address this within the limited horizontal screen space of the top row.
We are experimenting with turning the supply count turns amber a player is supply capped. This could be either informative or confusing, and we need more feedback on this feature.
Right column: Research timers
Many casters want to highlight the research of upgrades and abilities in StarCraft 2. Like the appearance of a new unit on the field, the completion of an upgrade/ability can represent a new phase in the game, and can be primary reason for a player to attack at a specific moment. Technology research is a fundamental dynamic of the game of StarCraft. (As well as an idea close to our hearts at the MIT Game Lab.)
However, ongoing upgrade/ability research is currently displayed in the production tab, where it disappears as soon as it becomes relevant. It also appears in the command card, which is almost invisible in popular observer layouts, or in the upgrade tab, where it sits among other upgrades that may have outlived their usefulness. Upgrades and abilities sorely need a dynamic visual representation that match their potential impact on the field of battle.
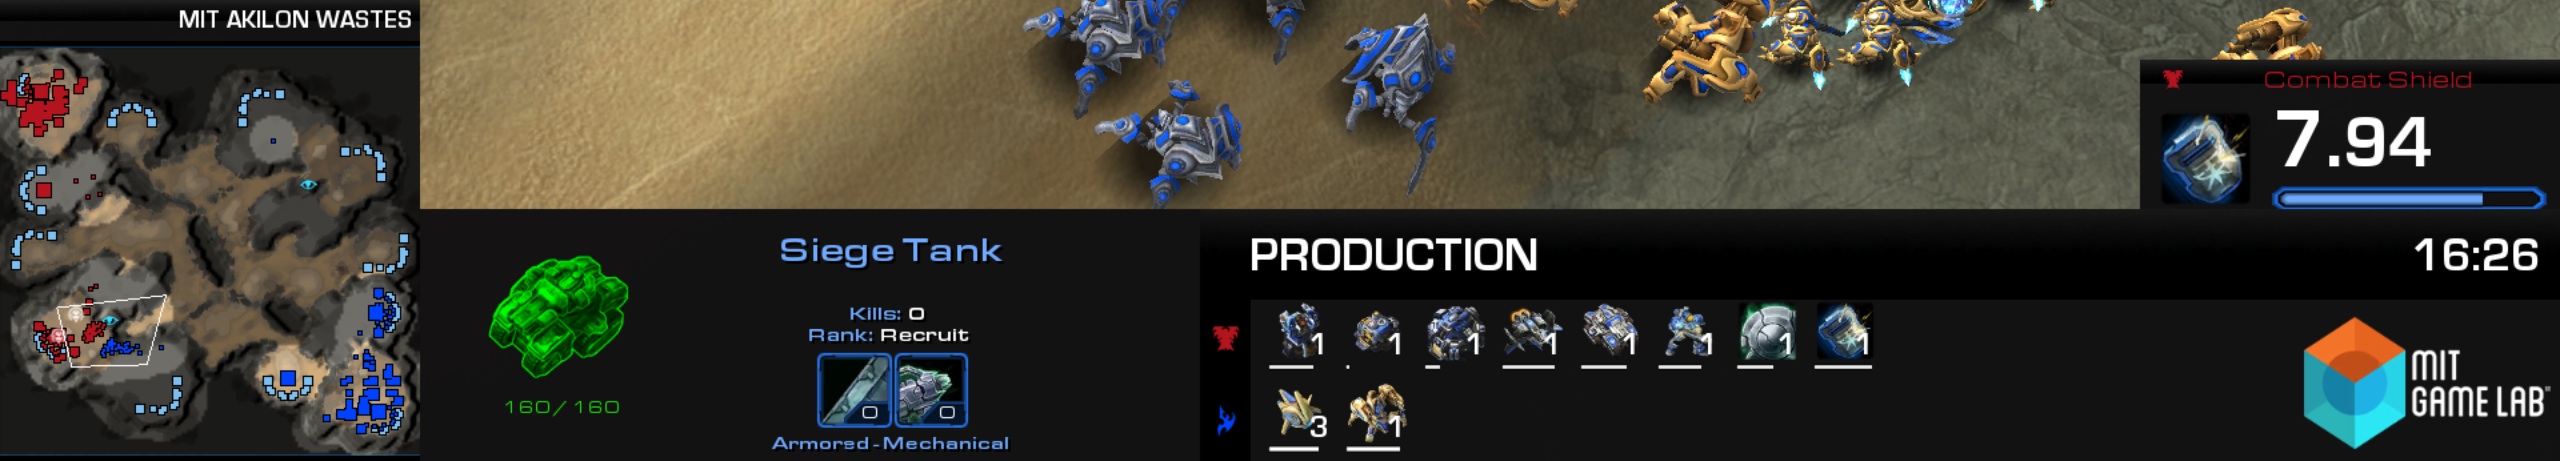
In our implementation, we give research the entire right side of the screen. When any upgrade has less than 30 seconds to completion, a panel appears with an large icon, a text description, a huge numerical countdown and progress bar. It is literally a “timing window”. We strongly encourage casters and spectators to chant in unison for potentially game-changing upgrades. To minimize distractions, casters can also dismiss irrelevant windows by clicking on them.
For instance, MMA often plans to drop infantry units at the precise moment when stimpack research is complete. Casters can focus the camera on the loaded medivac flying into an opponent’s base while the timer for Stimpack research counts off its last few seconds. Even though the spectators can’t actually see the infantry units, they have a huge visual that informs them that the amount of firepower contained in that medivac is about to suddenly increase.
The timers also indicate when a research has been denied. In live events, we often see some research really close to finishing while a drop attacks the researching structure. We get this kind of commentary from casters: “It’s so incredibly close, will it finish? Will it finish? WILL IT FINISH?… Did it finish? Maybe they cancelled it?”
If a researching structure is destroyed, our timers show “Denied”. If a player cancels the research, the timer shows “Cancelled”. If successful, “Completed”. These status indicators remain on the screen for 5 seconds before disappearing automatically.
Bottom row: Game state
To recap, the top row is targeted at spectators who are enjoying a live game in a group and who need to make quick visual comparisons to understand which player is ahead. In contrast, the bottom row focuses on information for experienced viewers and casters who typically watch games on dedicated personal computers. The information in the bottom row helps viewers analyze the state of the game, study army compositions, and copy build orders. The minimap remains in the lower-left corner with a slightly larger font for the map name.
Dedicated home viewers may engage in the Internet equivalent of channel-surfing using tools such as Teevox and MultiTwitch, particularly during tournaments that feature multiple simultaneous live streams. In the bottom-right corner, we prominently feature the game clock and a space for a “Station ID”, which is currently occupied by our lab’s logo but should feature the relevant tournament information. This will help stream-surfing viewers quickly identify the stream and tournament on screen and how far the current game has progressed.
Production Tab
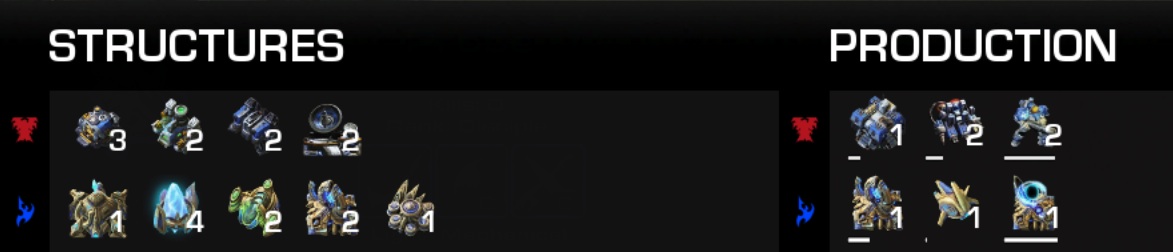
Units and buildings in production are central for crafting the story of a game, as the anticipated arrival of new entities on the field of battle is a source of great dramatic tension for spectators and casters. Blizzard’s Production leaderboard reveals the real-time decision-making of each player in a compact way, but can be obscured when casters need to analyze or reveal a different leaderboard, such as Units, Structures, or Army Value. We gave Production its own separate portion of the screen and put in a kludgey hack to ensure it always remains on screen.
Combined Infopanel and Leaderboards
In specific moments, the Unit Infopanel and Leaderboards are the perfect tools for casters to drive home commentary about the state of the game. However, we noticed that the Unit Infopanel is rather distracting and uninformative outside of such moments, while the Leaderboards are easy to miss when they typically share space with the Production tab.
By combining the Infopanel, Leaderboards, and our new graphs into the same space, we conserve limited screen real estate while narrowing viewer attention to just one area in the bottom row. Casters can freely use that space to illustrate any topic in their commentary without worrying that viewer attention might be distracted elsewhere on screen. (At least, that’s our theory.)
Workers Lost graph (“W” key)
Three years of StarCraft 2 casting has made one thing clear: it’s hard to figure out how many workers were killed after the first harass! Casters always want to state the number of workers killed after a successful attack on the mineral line, but they currently have to remember and mentally calculate the difference of the “Workers Killed” metric from before and after the attack.
To minimize on the spot ‘caster math’, the Workers Lost graph tries to simplify this by showing how many workers were lost for each player in intervals of 30 seconds. In cases of simultaneous harass, the graph is a clear snapshot of who has gotten ahead in the past three minutes. e.g. ‘6 workers were killed by INnoVation’s hellbat drop, but a minute later, TaeJa got back with his great widow mine hit that killed 15 workers.’
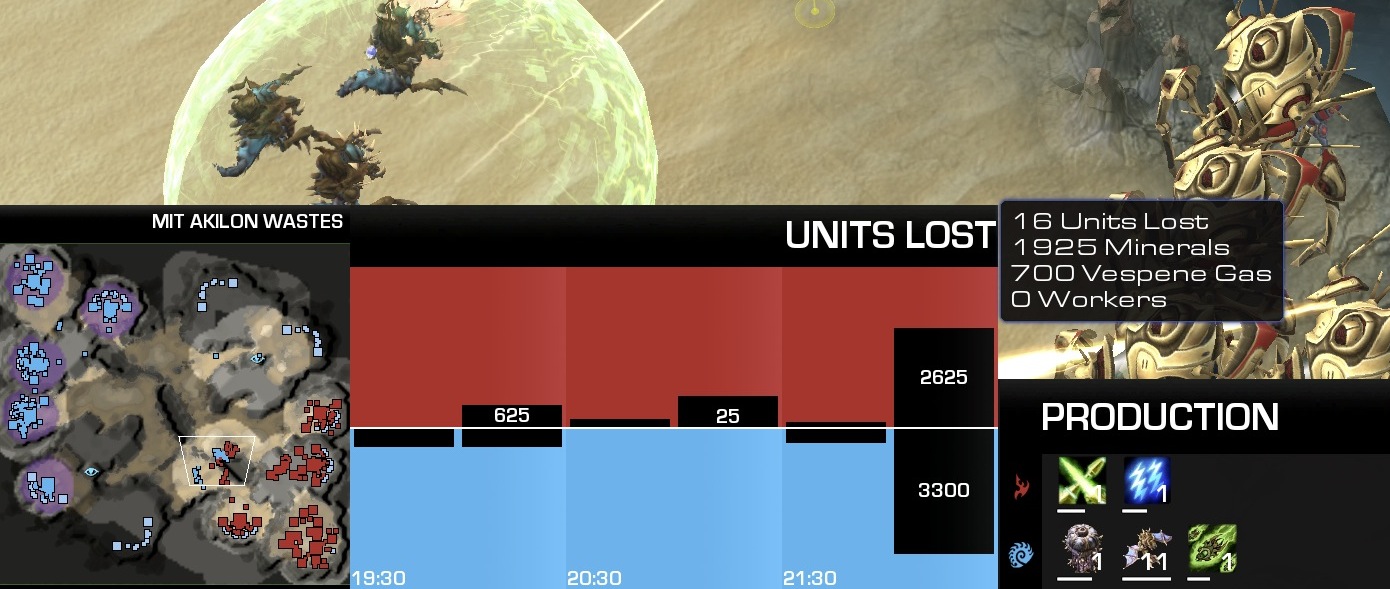
Units Lost graph (“K” key)
This graph helps casters illustrate “trading efficiency” when two armies meet in battle. By showing two adjacent graphs, we illustrate how many resources one player has lost compared to the other player, allowing casters to make observations about the efficiency of players. Furthermore, the graph reveals all army losses over the past three minutes, allowing comparisons between multiple engagements and easy visual recognition of trends.
Moving the mouse over any column reveals finer details about the total cost of all the units lost. This graph can show if a parade push is making economic headway over time, whether that last fight was really an even trade, or how imba swarm hosts are.
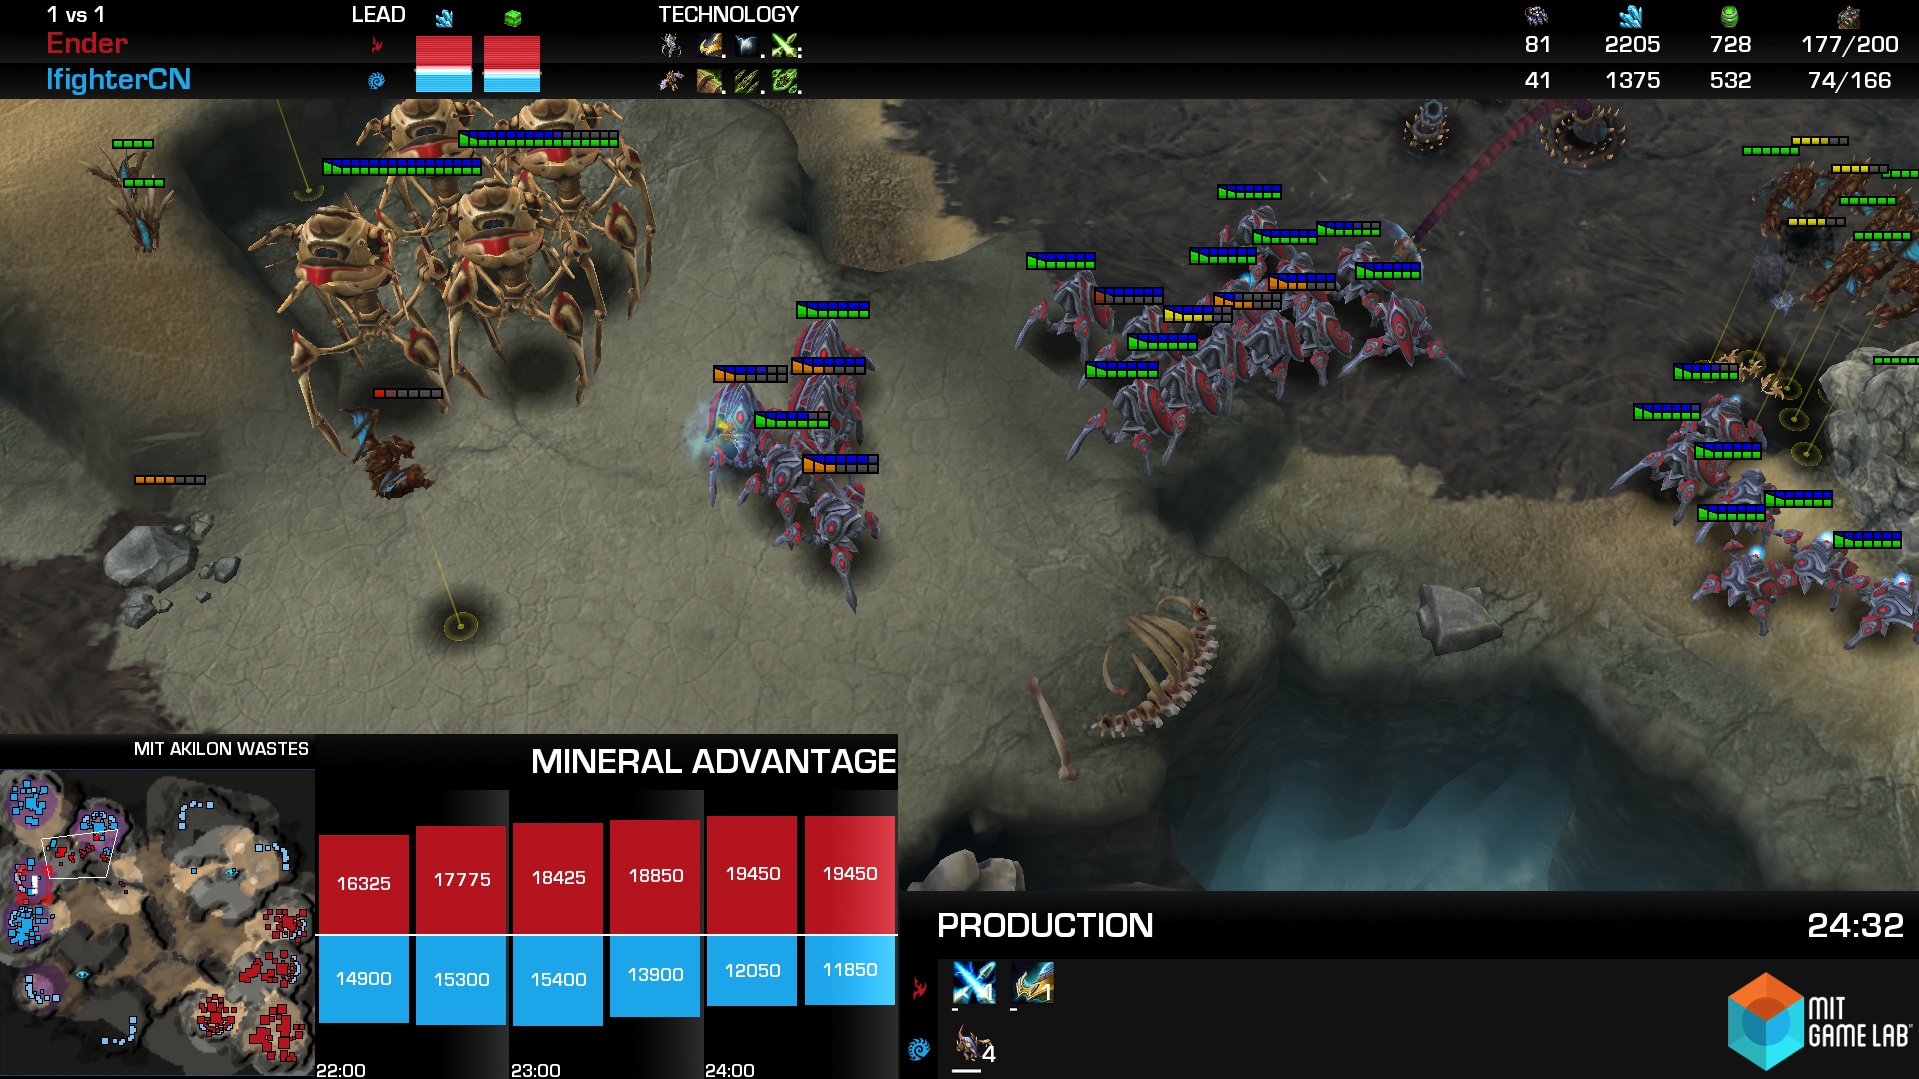
Mineral Advantage/Vespene Advantage graphs (“[” and “]” keys)
There are two basic ways to “get ahead” in a game of Starcraft: You can outspend your opponent, or you can inflict more damage than you sustain. We combined both production and combat activities into one metric for the Resource Lead panel in the top row, then stretch that metric over three minutes in the Advantage graphs to illustrate efficiency in terms of resource spending and retention.
Treating mineral and gas metrics in separate graphs, each column is the difference between total resources spent and resources lost, thus reflecting the existing combined army, building, and upgrade value of each player. e.g. ‘MMA was ahead until he engaged poorly with MC’s army. After this, MC decided to all-in counterattack, but it clearly didn’t work out for him very well because he doesn’t have the mineral advantage. MMA’s macro is pretty ridiculous, huh?’
The basic equation that we use to calculate the size of our bars is:
Player 1: (Spent[P1] – Lost[P1])/2/Max((Spent[P1] – Lost[P1]), (Spent[P2] – Lost[P2]))
Player 2: (Spent[P2] – Lost[P2])/2/Max((Spent[P1] – Lost[P1]), (Spent[P2] – Lost[P2]))
These graphs illustrate a story of who was ahead in the past three minutes. We hope to add a line graph on top of the bars to illustrate the difference between each player’s metric, similar to Gold and XP difference graphs in DOTA 2.
Across multiple trades, we’ve found this metric provides a fairly accurate representation of who is ahead at a given time, although it does not account for strong unit counters meeting each other in combat. In high-level games, absolute unit counters are pretty rare because of the prevalence of scouting. e.g. MC does not warp in only Zealots when he scouts incoming Mutalisks. Stardust, on the other hand, may choose to base race against Jaedong, in which case these graphs will reveal in real-time which player is in a better shape to survive.
Because these graphs can be visually overwhelming, we split minerals and vespene into separate graphs. Mineral and vespene advantage also illustrate different stories. For instance, in a ZvZ early game, the mineral lead is important because someone built their hatch earlier. In a PvP, vespene lead is can determine victory by reflecting the percentage of gas-heavy units in each Protoss army.
Resources remaining (“\”key)
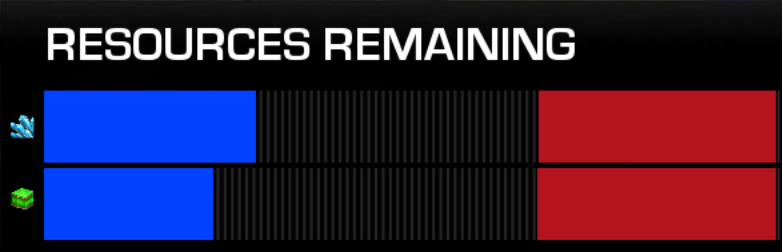 This graph illustrates how many unmined resources remain on the map as well as the cumulative depletion of mineral patches and gas geysers by each player. For most games, this graph could be used as a historical comparison of mining rates. In very long games, when the map is nearly mined out, a caster can use the graph to clearly illustrate how few minerals are left without hopping around the map showing empty mineral patches.
Visual style
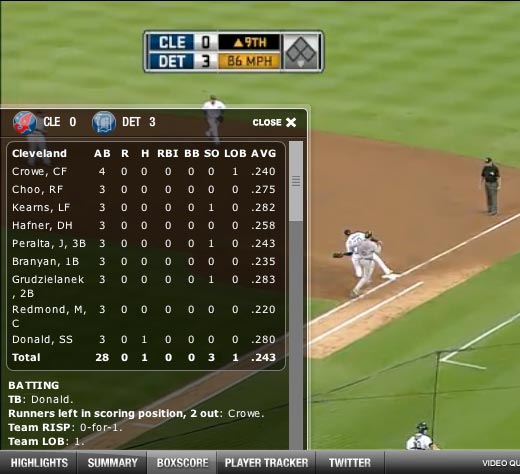 As described by Ryan Schutter from GameHeart, if the standard Blizzard SC2 viewer experience is an analog TV sports broadcast, his project aims to create the sensation of watching sports on a big-screen HDTV. In comparison, the MIT Overseer experience is closer to watching sports on a major league web portal, which typically feature pop-up panels of information displaying real-time data synchronized with the action on the field.
In our current implementation, only the caster has control over the display of information. We designed the screen layout assuming that the caster’s view will be captured and broadcast over a web-based video-streaming technology, with the goal of producing an entertaining show. Thus, font sizes are intentionally large to catch the spectator’s eye. Textures, rounded corners and transparency are minimal to improve legibility on low bitrate video streams. The Unit Infopanel is hidden when graphs are called up, so that attention is drawn to the data that the caster wants to highlight.
We did not design MIT Overseer for other common uses of StarCraft 2’s observer mode, such as off-camera caster computers, postgame analysis, or coaching, but we are curious about how MIT Overseer performs in those different situations as well.
Correlating color and advantage
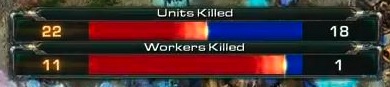 StarCraft’s default 1v1 observer interface currently allows casters to bring up large, central bar graphs that compare the current status for each player in 1-vs-1 games. Since each player is assigned a different color, these diagrams are designed around a rule-of-thumb in which a larger bar of a player’s color means that the situation is better for that player.
For instance, the “Workers Killed” tug-of-war bar illustrates that the blue player lost 11 workers and the red player is ahead. If this graph was titled “Workers Lost”, the blue bar would be larger than the red, but the blue player would still be at a disadvantage.
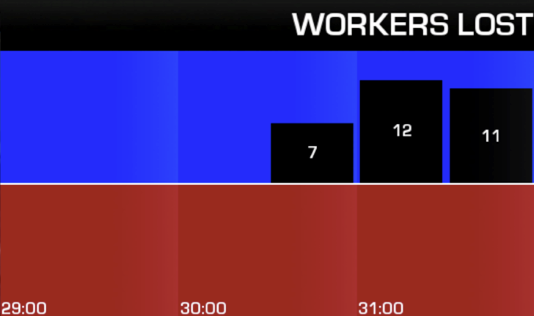 However, a “Workers Lost” statistic allows viewers to empathize with the player who suffered more damage and could be easier to verbalize. (“How many workers did Philip lose in that last fight?”). We stuck to this idea by depicting the “Workers Lost” and “Units Lost” graphs as black bars on a colored background. When a player loses workers, more of his or her color is hidden behind a black bar.
We have also tried to keep the positioning of player data consistent throughout the screen. Player 1 is always above Player 2 in the top and bottom rows. The only exceptions are the research timers, which propagate from the bottom of the screen in estimated order of completion. (Chrono boost, Contaminate, and unpowered structures can also affect the order of research completion.)
Technical notes
In a 16:9 broadcast, player face cameras could be overlaid in two possible locations: between the Workers and Technology icons in the top row, or between the Production tab and the right edge of the bottom row, obscuring the Station ID. There isn’t much space for player face cameras when StarCraft 2 is played in a 16:10 aspect ratio.
Many standard observer functions are not available, such as the 1v1 comparison panels, Units Lost icons, and zoom-out. Replays don’t look good at all. We are hoping to address these issues during a planned overhaul to the underlying architecture of the mod.
What’s next?
Our test map, “MIT Akilon Wastes,” is currently available on Battle.net NA for anyone interested in trying out the MIT Overseer interface. (You will need to use Blizzard’s Galaxy Editor if you wish to inspect our code.) IMPORTANT: The player that creates the custom game on our test map is the observer and must be player 1. The next two players who join will be 1v1 opponents and must be players 2 and 3. Reordering the players in the game lobby messes things up a bit.
While the current implementation of both GameHeart and MIT Overseer are mutually exclusive, the ideal solution should eventually allow tournaments to broadcast using whatever features they choose. We are following the development of Blizzard’s observer interface and GameHeart 2.0 closely to see if MIT Overseer features can be included as a dependency, along the same lines as their plans for the Stronger Team Colors functionality. To that end, we are continuing development with MIT Overseer to make it easier for casters, tournaments, and other mod-makers to take advantage of our code.
Shoutouts
- Nick Mohr for doing all the heavy lifting on this project!
- Abe Stein and T.L. Taylor for their insight into competitive games
- MIT Starleague for playtesting
- Blizzard for their mod framework and responding to our questions
- Team GameHeart (Ryan Schutter and Christoph “Ahli” Ahlers) for their groundbreaking work
- ESL/Turtle Entertainment for sharing their code, especially David “Icicle” Rynearson
- The SC2Mapster community for providing great information
Philip Tan is the creative director for the MIT Game Lab. He teaches CMS.608 Game Design and CMS.611J/6.073J Creating Video Games at the Massachusetts Institute of Technology. For the past 6 years, he was the executive director for the US operations of the Singapore-MIT GAMBIT Game Lab, a game research initiative. He complements a Master's degree in Comparative Media Studies with work in Boston's School of Museum of Fine Arts, the MIT Media Lab, WMBR 88.1FM and the MIT Assassins' Guild, the latter awarding him the title of "Master Assassin" for his live-action roleplaying game designs. He also founded a DJ crew at MIT.